We can, therefore, compare the heat losses of a building with those of a tank.

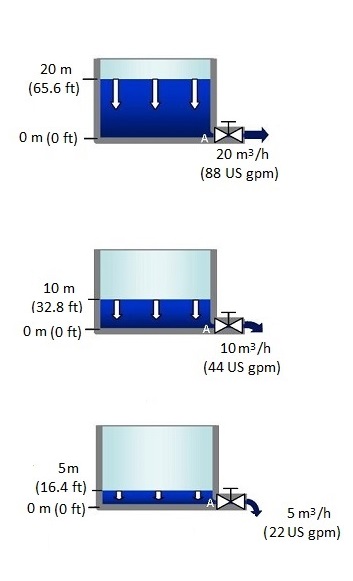
The fuller the tank, the greater are the water losses.
It is the pressure at point A, at the bottom of the tanks above, that generates the flow of the leak; the lower the pressure, the less the flow.
This pressure at point A is usually calculated in [bar] and is in proportion to the height of water above the leak. Remember that 1 [bar] corresponds to a height of 10 [m] of water (32.8 ft).
The pressure at A for the 3 diagrams above is as follows:
- pA = 2 [bar] in the left tank
- pA = 1 [bar] in the middle tank
- pA = 0,5 [bar] in the right tank
As a result, the leak flow diminishes at the same speed as the height of the water (In reality, the leak flow is not exactly in proportion to the level of water, but for simplicity, we will ignore this).
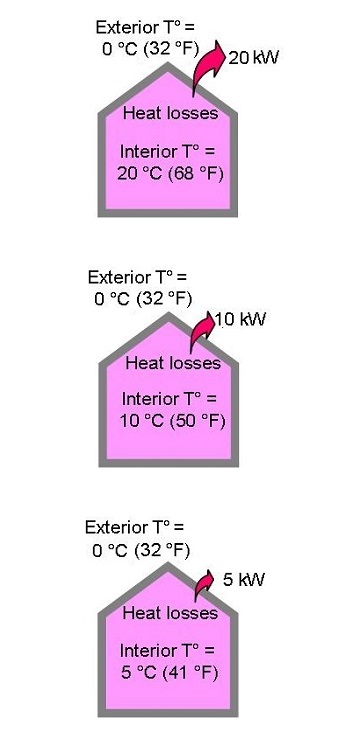
Similarly heat losses reduce as the room temperature drops.
Heat losses reduce as the difference in interior and exterior temperature
reduces.

Building heat losses evolve in proportion to the difference between interior
and exterior temperature.
Question
Given the proportionality mentioned above, explain why the building heat losses above, pass successively from 20 [kW] to 10 [kW], then to 5 [kW].
For the house on the left, the temperature difference between inside and outside is:
20 – 0 = 20 [°C] (20 K), the loss is 20 [kW].
- For the middle house, the temperature difference between inside and outside is:
10 – 0 = 10 [°C] (10 K), the heat loss is now only 10 [kW].
- For the house on the right, the temperature difference between inside and outside is:
5 – 0 = 5 [°C] (5 K), the heat loss is now only 5 [kW].Of course, when the house is completely cold at 0 [°C] (32 °F), the heat loss is zero.
