Maximum radiation power received at ground level is approx. 1,000 [W/m²].
This varies a lot with the amount of cloud cover, the angle of incidence of the
sun in relation to the receiving surface and its orientation.
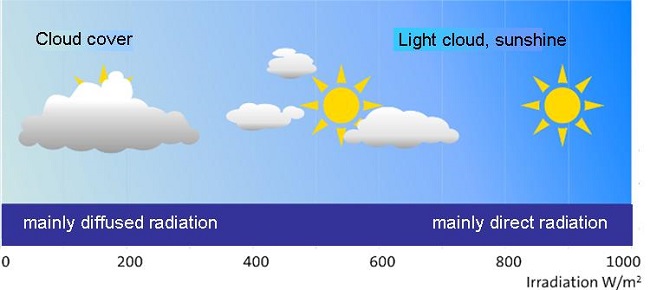
Thus, when making calculations, it is best to integrate weather factors and to
refer to quantities of energy (and not power) supplied (see
courses Energy and heat and Power in HVAC ).
To achieve this we have many charts and solar maps available which indicate
in [Wh] or [kWh] the radiated energy received by solar collectors with average
daily or annual defined angles of orientation.
We have:
- Annual solar maps (daily average, south facing)
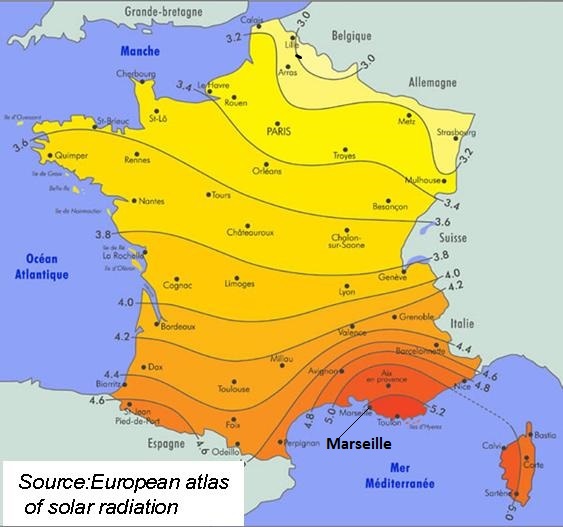
Global daily average radiation in [kWh/m2 (solar cells facing south angled as per latitude)] over the year
On the solar map above we can note the following sunshine exposure rates:
- 3.2 [kWh/m²] ( 10,918 btu/m2) in Lille (north of France)
- 3.8 [kWh/m²] (12,966 btu/m2) in Lyon (south centre of France), i.e. 20% more than in Lille
- 5.2 [kWh/m²] (17,743 btu/m2) in Marseille (south of France), i.e. 35% more than in Lyon.
To produce the same amount of heat energy from solar collectors, between 20 and
30% extra surface area of collectors would be required in Lille compared to
Lyon, and 70% more than in Marseille.
Question
Knowing Q = P x t
With:
– Q in [kWh],
– P in [kW],
– t in hours.
On the basis of 12 [h] of sunshine per day, what is the average radiation power received in Marseille by a solar collector facing south, over the year?
Q = P x t
With Q in [kWh]
P in [kW]
t in hours
The quantity of solar energy for one day in Marseille is 5.2 [kWh/m²] (17,743 btu/m2)
We can therefore state that for 1 [m²] of solar collector surface:
5.2 = P x 12
So, P = 5.2 / 12 = 0.433 [kW/m²]
= 433 [W/m²] (1,477 btu/m2)
- Monthly solar map (daily average, month of July, facing south)
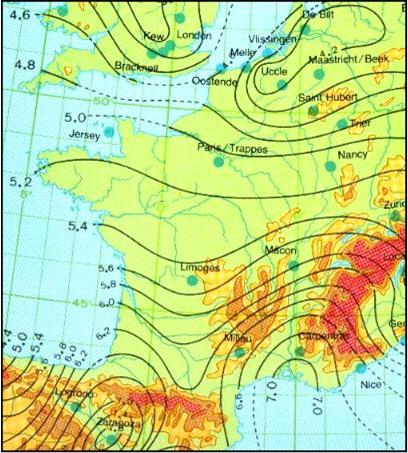
Source: European atlas of solar radiation
Question
On the basis of 12 [h] of sunshine per day, what is the average radiation power received in Marseille by a solar cell facing south, in the month of July?
Q = P x t
With:
– Q in [kWh]
– P in [kW]
– h in hours
According to the solar map, the quantity of solar energy for one day in Marseille in the month of July is 7 [kWh/m²] (23,884 btu/m2).
We can therefore state that :
7 = P x 12
So: P = 7/12 = 0.583 [kW/m²]
= 583 [W/m²] (1,989 btu/m2)Compared to 433 [W/m²] (1,477 btu/m2) over the year, which clearly shows the mildness of the Mediterranean climate.
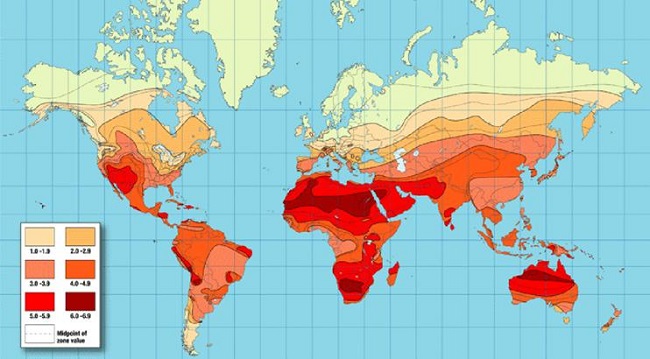
There are solar maps which indicate annual solar radiation rates throughout
Europe.
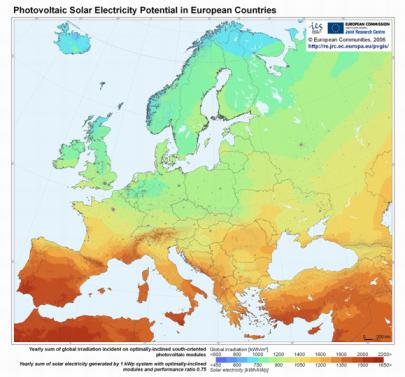
Question
The European solar map above indicates for Marseille an annual energy flow of approx. 1,900 [kWh/m²] (6,483,068 btu/m2).
Check the coherence of this data with that indicated on the national map below (on which we note an average daily sunshine exposure rate of 5.2 [kWh/m²] (17,743 btu/m2) in Marseille).
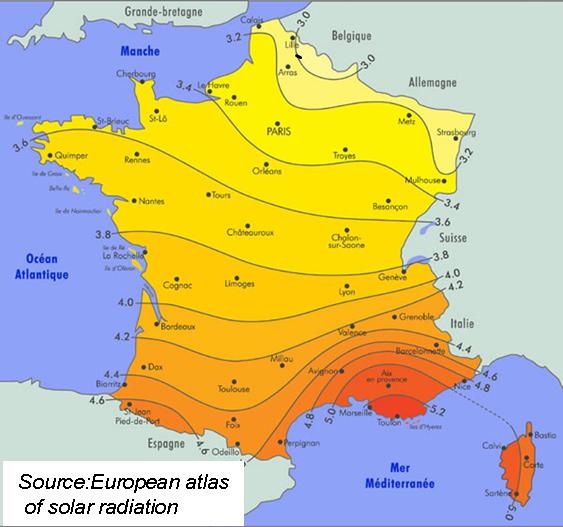
On the solar map of France above, we note an average daily sunshine exposure rate of 5.2 [kWh/m²] (17,743 btu/m2) in Marseille.
Over the year this corresponds to 5.2 x 365 = 1,898 [kWh/year] (6,476,243 btu/yr) which is more or less what we find on the European map.
And finally, there are solar maps covering the whole world …
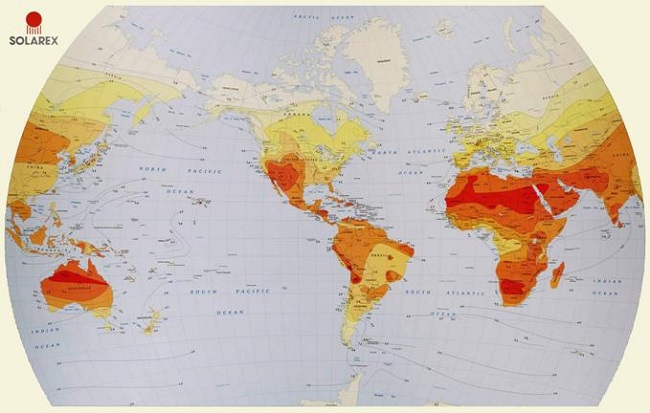
World solar radiation map, source Solarex
Source: matthewb “Use
Technology Efficiently”