Now that we have understood how to use a head loss chart for piping we can understand how manufacturers can indicate water circulation head losses for their equipment.
Question
Referring to the boiler pressure loss chart below, what is the head loss in [mbar] and in [mmH2O] for a model of 500 [kW] with a flow rate of 10 [m³/h] (44 US gpm)?
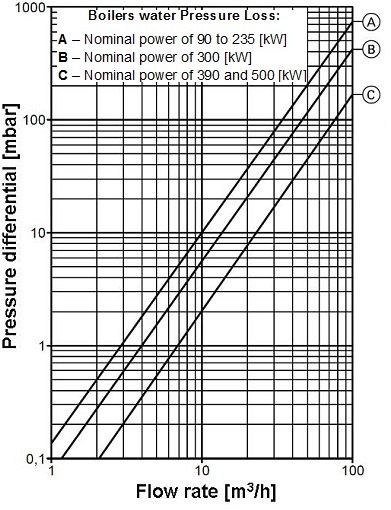
2 [mbar] 20 [daPa] Remember: 1 [bar] = 10 [mH2O] (32.8 ft H2O) = 10,000 [mmH2O] (394 inch H2O) 1 [bar] = 100,000 [Pa] 1 [mbar] = 100 [Pa]
Question
Referring to the boiler head loss chart above, what is the head loss in [mbar] and in [mmH2O] for a model of 300 [kW] and a debit of 20 [m³/h] (88 US gpm)?
20 [mbar] 200 [daPa]
Question
Referring to the boiler head loss chart below, what will be the head loss in [mbar] and in [mmH2O] for a model of 140 [kW] running at a temperature regime of 80/60 [°C] (176°F/140°F)?

4 [mbar] 40 [daPa] Explanation: 140 [kW] at a temperature regime of 80/60 [°C] (176°F/140°F) corresponds to a flow rate of: qv = P / (1.16 x ∆T) = 140 / 1.16 x 20 = 6 [m³/h] (26.4 US gpm).